Q1-24 Move-In and Move-Out Analysis For Senior Living Communities
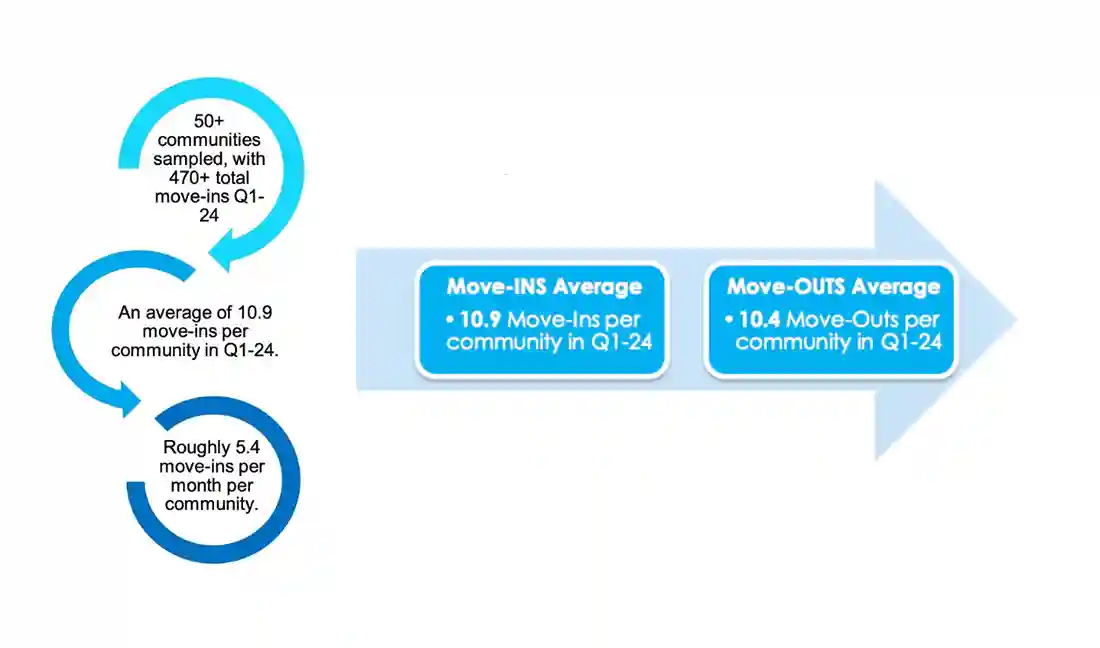
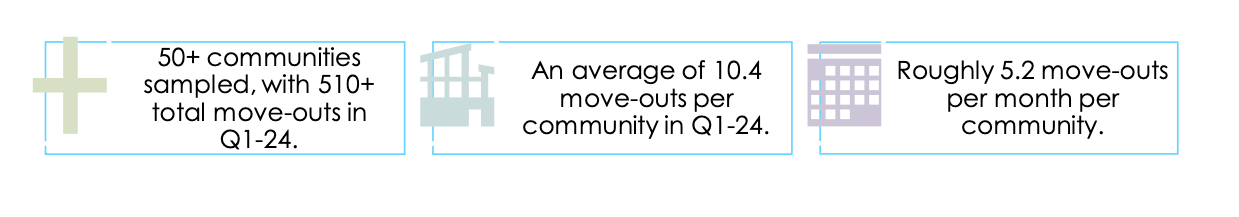
Bild & Co analyzed 50+ senior living communities in Q1-2024. This white paper focuses on move-ins and their sources, move-outs and their reasons, and the average length of stay. This study targets multiple states in the U.S. Below is the executive summary and key findings.
Target: 24 different states
Time Periods Data Analyzed: 1/1/2024 – 3/31/2024
Data Reviewed: Move-Ins, Move-Outs, and Average Length of Stay
Below is a summary of the key findings:
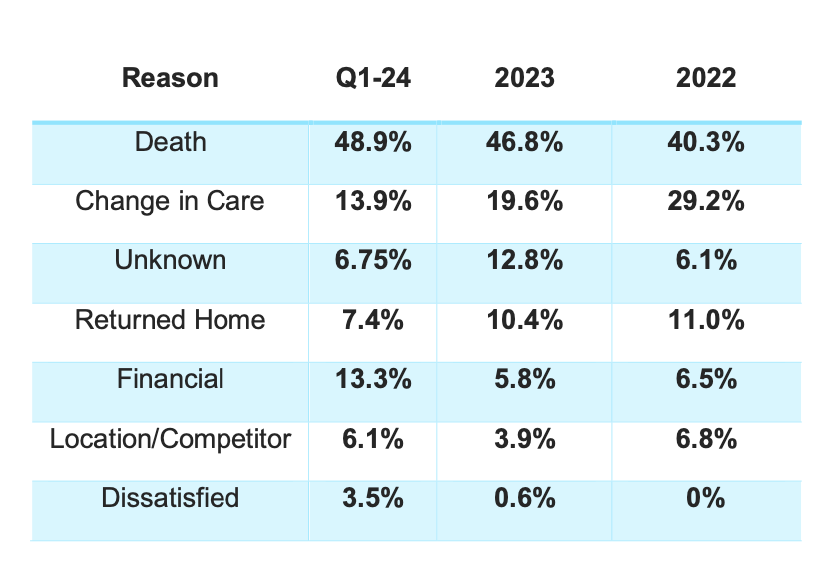
- The most common move-out reason reported in 2023 (excluding death and unknown reasons) is residents needing a higher level of care.
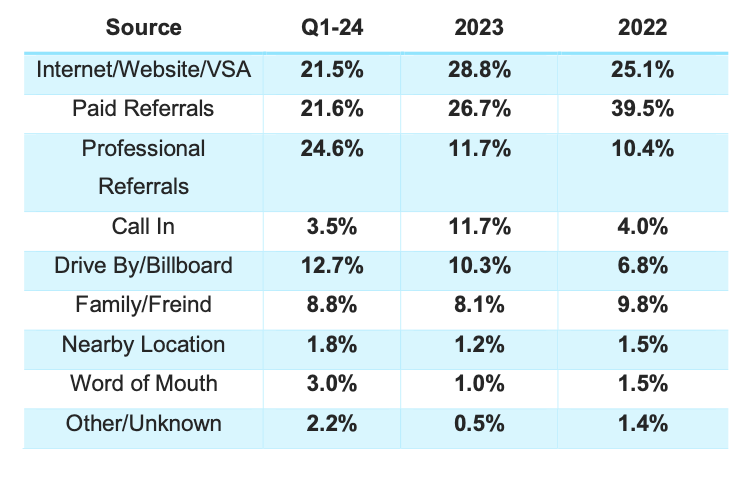
- Move-ins originated substantially from professional referral sources, APFM, and other paid referral sources, encompassing 46.2% of all Q1-24 move-ins.
- The average length of stay for a resident in 2023 was 682 days and has decreased in Q1-24 to 547 days.
Top 5 Reported Move-In Sources in Q1-24:
- Professional Referral Sources (24.6%)
- APFM/Paid Referral Sources (21.6%)
- Internet/Website/VSA (21.5%)
- Billboard/Drive by (12.7%)
- Family/Friend/Resident (8.8%)
Top 5 Reported Move-Out Reasons in Q1-24
- Death (48.8%)
- Needs Higher Level of Care (13.9%)
- Financials (13.3%)
- Returned Home (7.4%)
- Unknown (6.75%)
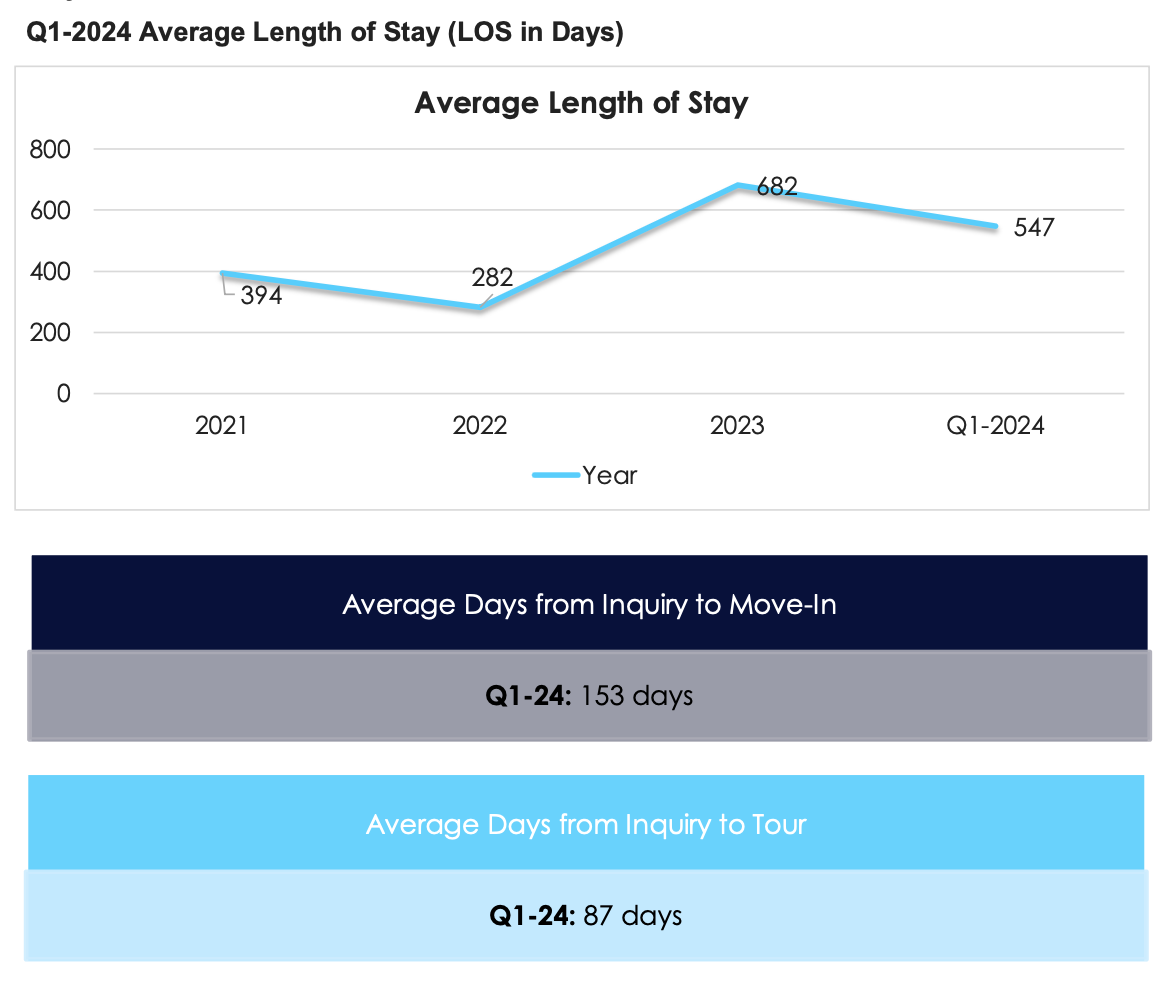
- Previously in Q1-2023, the average was 82 days. Compared to Q3-2023 and Q4-2023, which both saw an average of 64 days. In Q1-2024, the average number of days from inquiry to tour is reflecting a bit higher at 87 days.
- In 2023, we saw 170 days from inquiry to move-in. Looking back to Q1-2023, the average was lower at 116 days but higher towards the end of the year. Now in Q1-2024, we are seeing roughly 153 days from the time of inquiry to move-in.