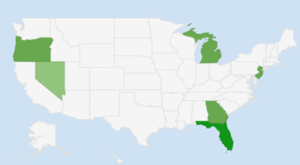
The following results reflect the overall growth in sales activity, tours, conversions, and response rate with a client that implemented BILDX across 10 communities. The below data compares 5 months prior to BILDX and then 5 months with BILDX being implemented. Locations that are implementing BILDX reside in the Eastern, Western and Midwestern Region of the U.S.
Target: GA, MI, OR, NV, FL, NJ
Time Period: Jan-Feb ‘24 vs. Mar-July ‘24
Data Reviewed: Before and after BILDX regarding, response rates, sales activity, tour volume, and lead sources.
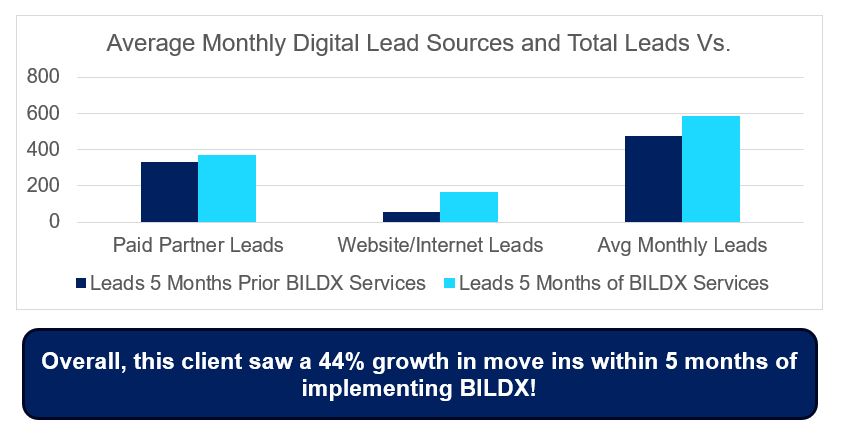
Below is a summary of lead volume and response rates:
Lead Source Analysis
- Overall, each community saw a 23% average increase in total leads. 91% of those new leads were digital.
- A Place For Mom was 54% of the paid partner leads.
- 84% of the Website/Internet Leads were from the website.

Response Rate:
5 months prior to BILDX implementation, this client had over a 3.5-hour average response rate for digital leads. After 5 months of BILDX implementation, the average response rate for an individual community was 3 minutes.
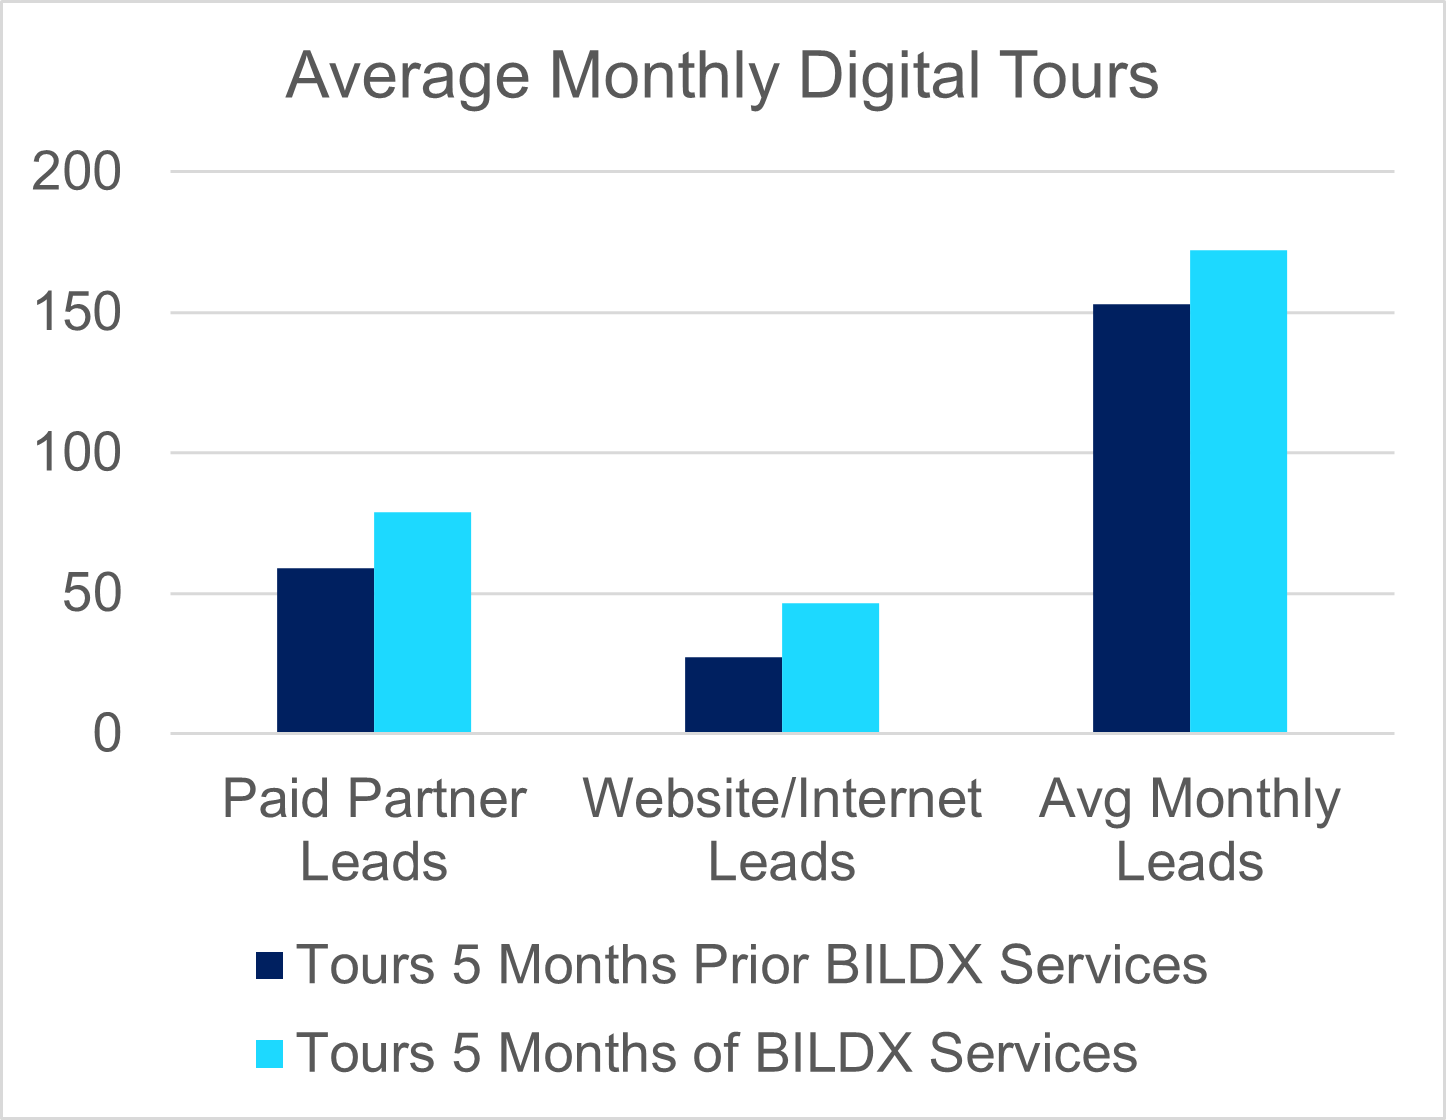
Tours:
5 months prior to BILDX implementation, the average community completed 11 tours per month. After BILDX, there was a 20% increase in successful tours per month.
Tours strictly from digital leads, increased by 45%.
Just within those 5 months, BILDX was able to schedule roughly 500 tours!
Deposits and Move Ins:
Deposits increased by 53% and move ins increased by 33% within those 5 months of utilizing BILDX services.

Sales Activity Summary:
- Calls and emails increased over 191% with BILDX services.
- On average, a community was conducting 119 calls per month. After BILDX was implemented, the monthly phone calls increased to 251.
- Text messages averaged 16 per month per community but increased to 152 texts per month with BILDX.
- Emails averaged 60 per month per community before BILDX, and then increased to 270 per month per community with BILDX.


